Debugging IIS Rewrite Rules
Where I work we have a number of ASP.NET web applications that run different parts of our site so that we can have some segregation of code and containment of scope without just having an enormous monolithic project that holds everything intermingled together. It’s nothing too exciting technically, but the marketing department also needs to be able to present the entire site as a whole to visitors, and the Google Bot, for that sweet sweet SEO juice (and easier navigation and other less cynical reasons I’m sure). The way we achieve that is with prodigious use of the IIS URL Rewrite engine, which allows us to create a set of rules that take the incoming HTTP requests and either route them through to different web applications, or different virtual paths, or stop some in their tracks entirely.
There is lots of documentation and examples on the web about setting these up, and I certainly don’t claim to be an expert in the full range of their capabilities, but one thing I do know is that whilst they are fantastic when they are working, and just sit there happily doing their job without complaint, when adding new ones it can sometimes appear to be a bit of a mystery as to whether they are working. Additionally, because we use them to consolidate a lot of different applications and URLs into one coherent set of public URLs, getting them running locally quickly ends up with requests to local environments being redirected to live environments, with no real way of knowing if it was because the rules are working perfectly, or simply because they fell through to some catch all at the end.
Fortunately there is a way to debug the rules, or at least get logging out of the engine, albeit a little hidden.
Not all failures are failures
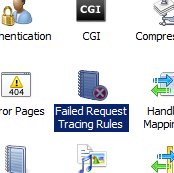
The answer lies in the IIS Failed Request Tracing feature and the fact that it is possible to configure it to trace successful requests just as easily as failed ones. The feature can be access through the IIS manager or the configuration can be specified in the web.config file of your application.

The module itself has quite a nice wizard to guide you through setting up a new rule, however to debug rewrites in the way that I want to, its a little unintuitive so I’ll detail exactly what I did.
The first step is straight forward enough, where you select which filenames you want to trace. In the modern era of MVC and WebApi this feels a little antiquated, since file names are a bit naff, so probably best, and certainly easiest, to just leave this selection on “All content”.
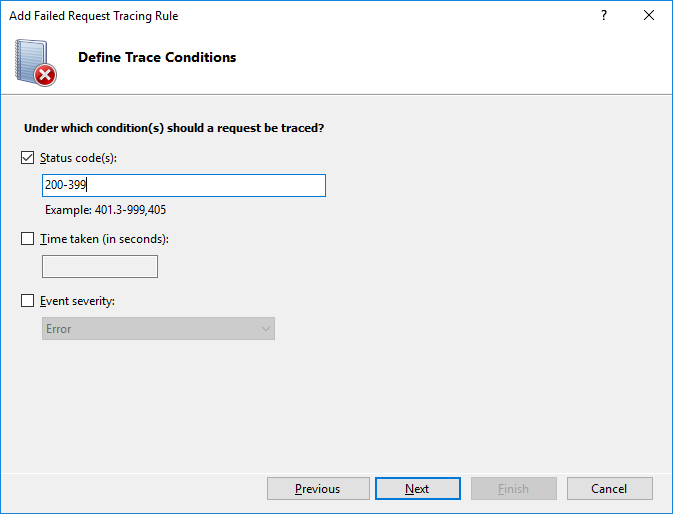
The second screen is where the real magic happens:

The first input option here is to specify which HTTP status codes should be traced, and this is where we flip the “failure” title on its head. By specifying a successful code here (ie, 2xx or 3xx) we get tracing for successful requests and not just failed ones.
Depending on how much logging you want happening, you could narrow this down to just the statuses you want to track, for example just specify 301 to trace permanent redirects, or you could widen it. I think starting as wide as you can and specifying 200-399 for this value is the best, that way even if you’re adding a new permanent redirect rule that you want to trace, you’ll get the logs even if you had something wrong with your rule and the request fell through to a different rewrite rule.
If the requests you’re trying to trace are getting through to your site and resulting in errors or bad URLs you also might want to add in 404 and 500 to the list.

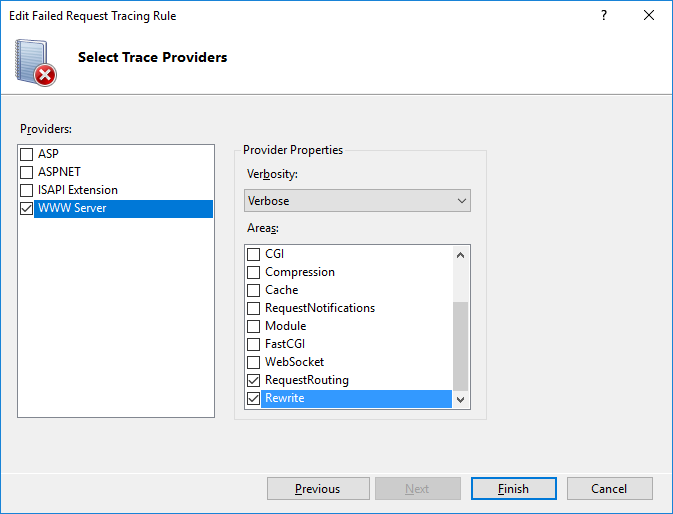
The 3rd screen allows for the selection of which IIS modules you want to trace so in order to keep some of the noise out of the log its best to untick everything except Rewrite and RequestRouting. Leave the verbosity at verbose, mainly because its fun to say “verbose verbosity”.
And thats it, you’re all configured. You can also configure the equivalent of all of this in the web.config file with the follow config:
<tracing>
	<traceFailedRequests>
	<add path="*">
		<traceAreas>
		<add provider="WWW Server" areas="Rewrite,RequestRouting" verbosity="Verbose" />
		</traceAreas>
		<failureDefinitions timeTaken="00:00:00" statusCodes="200-399" />
	</add>
	</traceFailedRequests>
</tracing>
Finally make sure the feature itself is enabled by clicking “Edit Site Tracing…” from the right hand bar and tick the Enabled checkbox. If it’s already enabled then great, but the screen is still useful to grab the path to the log files, which by default is %SystemDrive%\inetpub\logs\FailedReqLogFiles.
Looking at the log files
The Failed Request Tracing module logs to XML files which I definitely don’t recommend looking at in raw form. Fortunately IIS also generates an XSL file for you which nicely formats the logs into something vaguely readable. I’ve found the easiest way to view the logs is simply to open the XML file in Internet Explorer (yes, I know) as that will automatically find and apply the xsl file, whereas Chrome did not.
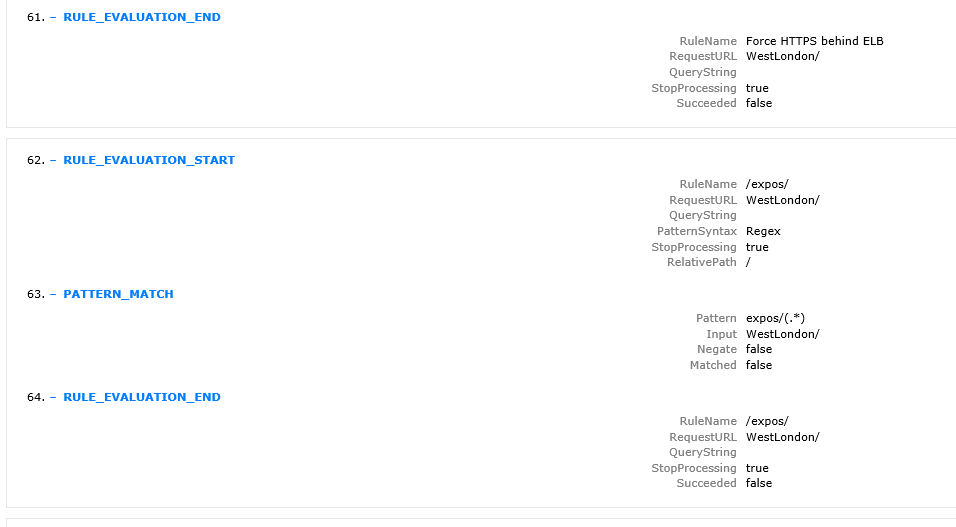
The logs themselves are quite verbose, as we requested:

You’ll see the output for each rule you have in your rewrite configuration, you can see the input values and the patterns matched against. You can see whether each on succeeded, though its worth noting that you need to apply the negate value yourself so a negative rule might say “Succeeded: false” and you have to remember that that means the rule as you wrote it did in fact match.
Hopefully after trawling through the file you can work out what is going on, though personally I found it easier to search the file for the rule you think is probably at fault, rather than scanning through them all, but I’m coming from a codebase with a lot of rules.
